

The Power of Comparative Financial Statements
 Your business has a story to tell. And one of the ways to hear your business’s story is by reading through comparative financial statements.
The importance of comparative financial statements
An up-to-date balance sheet, income statement and statement of cash flows are essential financial reports you should consistently analyze. But these financial statements by themselves don’t tell the whole story about your business. Consider the following:
- Company XYZ: The most current balance sheet shows $1 million in liquid assets with zero liabilities.
- Company ABC: The most current income statement has a net profit margin of 35%.
- Company 123: The statement of cash flows shows that the company has consistently brought in more cash than it has spent over the past three years.
And here’s the rest of the story:
- Company XYZ: Liquid assets decreased from $5 million to $1 million over the past 12 months.
- Company ABC: Net profit margin is typically around 20% for this company. However, a recent round of layoffs temporarily pushed total salaries and wages lower, while pushing the net profit margin much higher.
- Company 123: There has been a steady decline in positive cash flow over the past three years.
These examples show the importance of analyzing your financial statements in comparison with something else. Reading through the first list of bullet points only tells part of the story.
What you can do
Here are several types of comparative financial statements you can create for your business and some tips for getting the most out of these reports.
- Current period vs. Prior period. Compare this month to the same month one year prior (October 2021 vs. October 2020) or compare by year (2021 Year-to-Date vs. 2020 Year-to-Date).
- Current period vs. Current period forecast. This is known as a variance analysis. You compare what you think was going to occur during a particular period to what actually happened. This report can also be done either by month [October 2021 (actual) vs. October 2021 (forecast)] or by year [2021 Year-to-Date (actual) vs. 2021 Year-to-Date (forecast)]
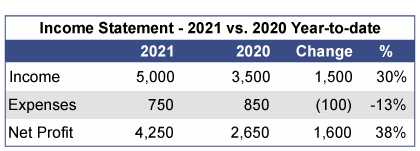
- Use both absolute figure and percentages. Percentages allow you to quickly see the degree of change between the two periods that are being compared. Here’s an example of what this could look like:
- Ask for help! Please contact your financial advisor or accountant if you would like help creating or analyzing comparative financial statements for your business.